
eLichens’ Global Air Quality Map has been improved to better match the needs of citizens’ communities and organizations who are curious about local pollution and are willing to take positive action to improve their quality of living. Everyone can access it for free.
WHAT’S NEW?
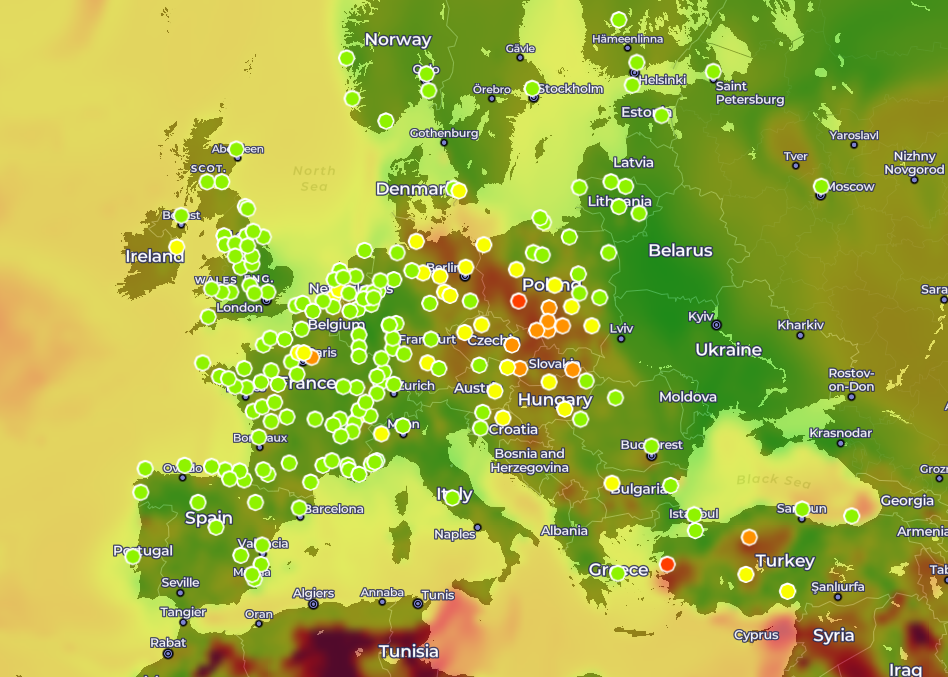
Street pollution forecasts are available in 300 cities
Street-level pollution for 300 cities worldwide
The map now features real-time pollution in each street within 300 global cities. The Air Quality Index (AQI) and concentrations of pollutants in these cities are generated by eLichens’ proprietary model. Users can see them in high resolution (5 meters) and benefit from our exclusive forecast. Starting next spring, a Pollen Map will be available for Europe.

eLos provides new measurements every 20 minutes
Real-time data from eLos stations and local agencies
eLichens’ air quality modeling technology uses the most reliable data inputs. Our map now displays real-time measurements of eLos Outdoor Air Quality Stations and more than 8,000 monitors used by local Air Quality Agencies worldwide.
An enhanced user experience
A lateral dashboard was incorporated to give users the quickest access to the concentrations of the main ambient pollutants that impact human health including Particulate Matter 2.5 and 10, Ozone (O3), Nitrogen Dioxide (NO2). The map is more intuitive thanks to new visuals and features.
Free and unlimited access for all
eLichens is now providing free-access to the Global Air Quality Map without login.
A free mobile application and additional features will be launched in 2021.
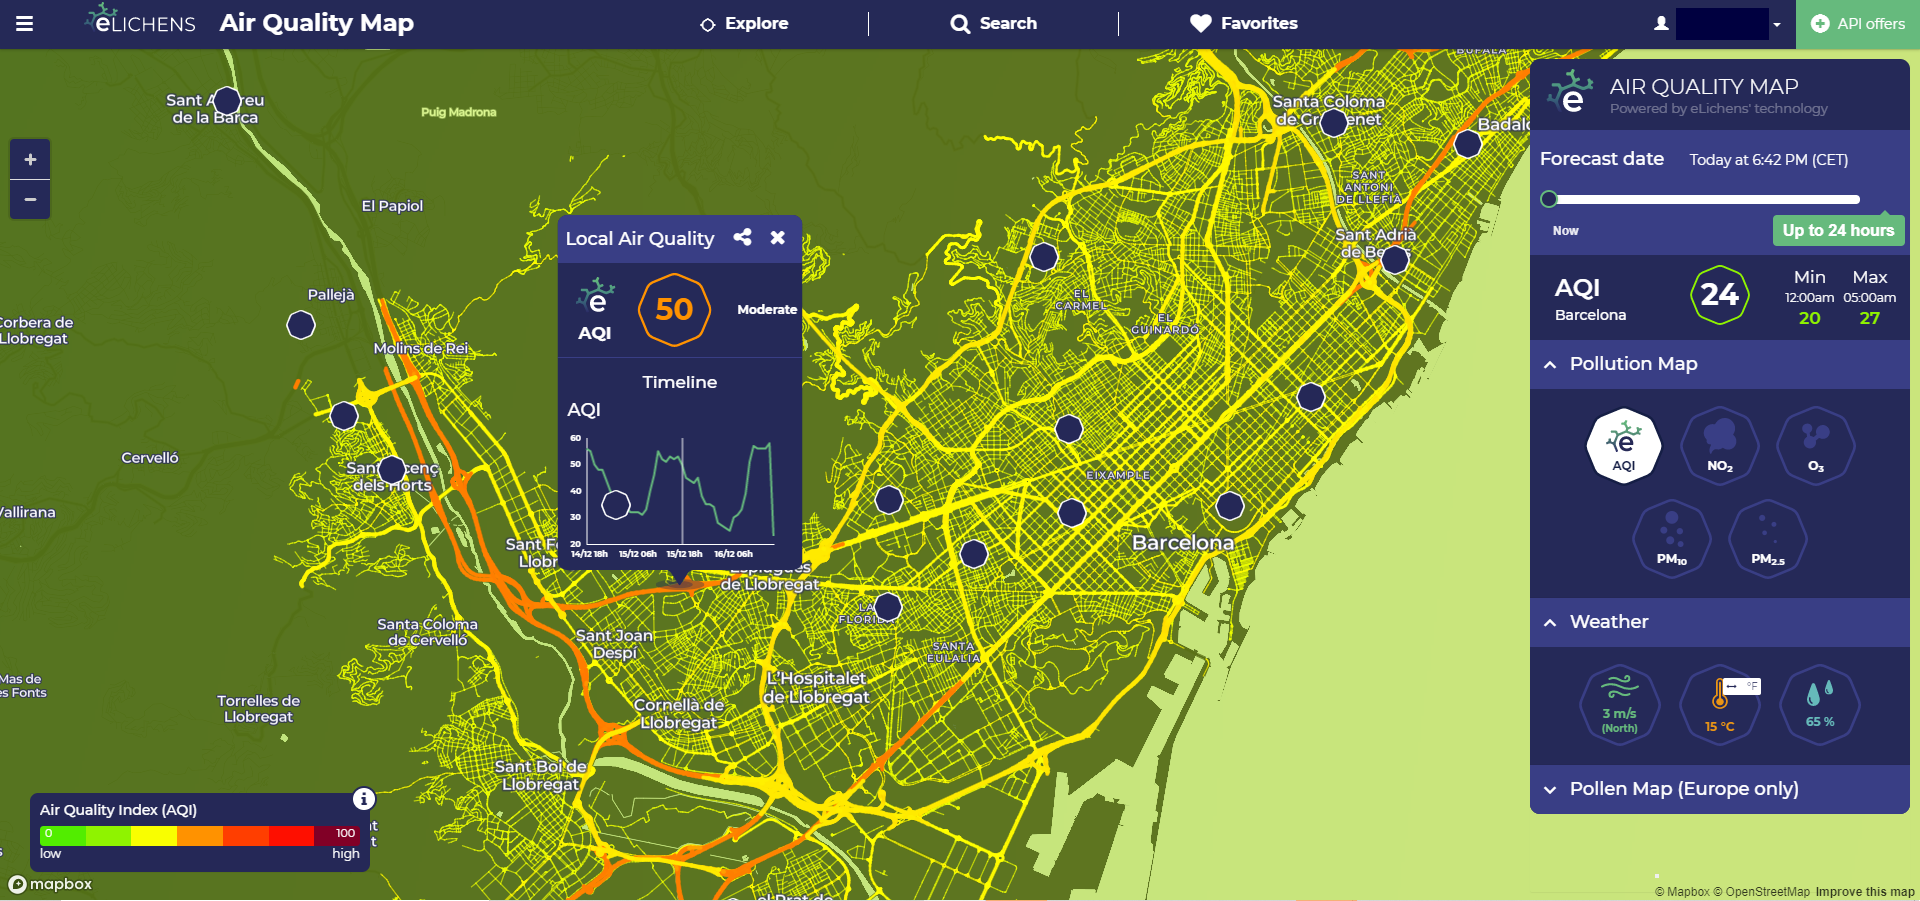
Desktop view of eLichens’ Air Quality Map
About eLichens’ Air Quality model
eLichens’ Global Air Quality Map uses advanced algorithms and technology to communicate the most up-to-date and accurate pollution data in high resolution.

